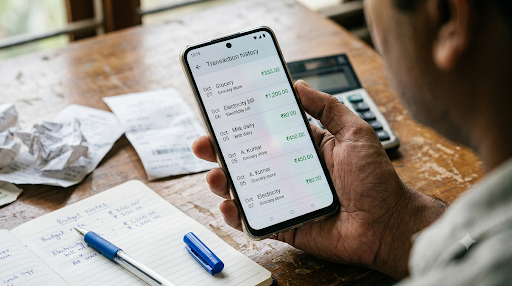

Managing money becomes easier when you know exactly where it goes. A monthly expense tracker excel spreadsheet helps you record daily spending, organize expenses into categories, compare actual spending against your budget, and understand how much money remains at the end of the month.
You do not need advanced Excel skills or expensive budgeting software. A simple spreadsheet with a few columns and basic formulas can help you track rent, groceries, transport, electricity, subscriptions, and other everyday expenses.
This guide explains how to create a monthly expense tracker in Microsoft Excel in seven practical steps, using Indian rupees and realistic examples. You will also learn how to calculate total spending automatically, identify overspending, and maintain a budget consistently.
Table of Contents
What Is a Monthly Expense Tracker in Excel?
A monthly expense tracker in Excel is a spreadsheet used to record, categorize, and analyze personal or household expenses over a month. It typically includes transaction dates, expense categories, descriptions, amounts, and payment methods.
With basic Excel formulas, the spreadsheet can automatically calculate total expenses, category-wise spending, and the difference between your income and expenditure.
For example, someone earning ₹30,000 per month might use an expense tracker to understand how much they spend on rent, groceries, transportation, bills, and entertainment.
Instead of guessing where the money disappeared, they can review actual transactions and make informed budgeting decisions.

What Should a Monthly Expense Tracker Include?
A useful beginner-friendly expense tracking sheet should contain:
- Transaction date
- Expense category
- Description of purchase
- Amount spent
- Payment method
- Monthly income
- Monthly expense total
- Category-wise budget
- Remaining balance
- Savings allocation
You can start with just five transaction columns and add a budget summary as you become comfortable.

Why Use Excel for Monthly Expense Tracking?
Microsoft Excel provides a flexible way to manage household and personal spending.
Unlike a handwritten expense notebook, Excel can calculate totals automatically and organize large numbers of transactions.
1. Understand Where Your Money Goes
Small transactions are easy to overlook.
A ₹100 snack, ₹150 delivery charge, or ₹200 impulse purchase might seem insignificant individually.
But when these purchases are recorded together, you can see their combined impact on your monthly spending.
2. Compare Budgeted and Actual Expenses
Suppose you plan to spend ₹4,000 on groceries but actually spend ₹5,200.
Your tracker immediately shows that groceries exceeded the planned budget by ₹1,200.
This information helps you adjust your next month’s spending plan.

3. Identify Unnecessary Spending
A spreadsheet can reveal recurring costs such as unused subscriptions, frequent food deliveries, and avoidable convenience purchases.
The purpose is not to eliminate every enjoyable expense. It is to make spending decisions consciously.
4. Build Better Saving Habits
Tracking expenses can help you identify money that may be redirected toward emergency savings, debt repayment, or other financial goals.
However, recording expenses alone does not guarantee savings. You still need a realistic spending plan and consistent follow-through.
How to Create a Monthly Expense Tracker Excel Sheet in 7 Steps
You can create a simple monthly expense tracker in Excel without using macros, advanced formulas, or programming.
Follow these steps.
Step 1: Open Excel and Create a New Workbook
Open Microsoft Excel and select Blank Workbook.
Rename the first worksheet:
Monthly Expenses
Create a second worksheet called:
Budget Summary
The Monthly Expenses sheet will contain individual transactions.
The Budget Summary sheet will display income, spending totals, category budgets, and remaining money.
Save the workbook with a descriptive filename, such as:
Monthly_Expense_Tracker_2026.xlsx
For easier identification, you can also include the month and year in the filename.
Step 2: Create Expense Tracking Columns
In the Monthly Expenses worksheet, enter these headings in Row 1:
| Column | Heading |
|---|---|
| A | Date |
| B | Category |
| C | Description |
| D | Amount (₹) |
| E | Payment Method |
Now enter a few example transactions.
| Date | Category | Description | Amount (₹) | Payment Method |
|---|---|---|---|---|
| 01-Oct-2026 | Rent | Monthly house rent | 8,000 | UPI |
| 02-Oct-2026 | Groceries | Vegetables and milk | 650 | UPI |
| 03-Oct-2026 | Transport | Bus pass | 900 | UPI |
| 04-Oct-2026 | Food | Restaurant meal | 350 | Card |
| 05-Oct-2026 | Utilities | Electricity bill | 1,200 | UPI |
These are illustrative transactions, not average household spending figures.
Select the data and press Ctrl + T in desktop Excel to create a formatted table. Confirm that your table has headers.
Excel tables make it easier to filter categories and extend your transaction list.
For the following formulas, assume your expense records are entered in rows 2 through 1000.
Step 3: Add Monthly Expense Categories
Categories help you understand which areas consume the largest share of your budget.
For an Indian household, common categories include:
| Category | Examples |
|---|---|
| Rent | House rent, maintenance |
| Groceries | Rice, vegetables, milk |
| Transport | Petrol, bus, metro |
| Utilities | Electricity, water, gas |
| Food | Restaurants, snacks, deliveries |
| Healthcare | Medicines, doctor visits |
| Shopping | Clothing, household purchases |
| Entertainment | Movies, streaming |
| Education | Books, courses, fees |
| Other | Miscellaneous expenses |
Use consistent category names.
For example, avoid recording the same type of purchase under both “Food” and “Eating Out” unless you intentionally want separate categories.
You can also create a dropdown list for categories using Excel’s Data Validation feature.
This reduces typing mistakes and helps your formulas calculate category totals correctly.
Step 4: Calculate Total Monthly Expenses Automatically
Excel’s SUM function adds numerical values from a selected range.
If your expense amounts are stored in Column D, enter the following formula in an empty summary cell outside the transaction table:
=SUM(D2:D1000)
This calculates the total amount entered in cells D2 through D1000.
For example, the five sample transactions above total ₹11,100.
As you add more transactions within the referenced range, Excel recalculates the total.
Important: Do not place the total formula inside the same range it is adding. Doing so can create a circular reference.
You can also use Excel’s AutoSum feature if you prefer not to type the formula manually.
Official reference: Microsoft SUM function
Step 5: Calculate Category-Wise Expenses Using SUMIF
Total spending tells you how much money you spent.
Category-wise spending explains where that money went.
Excel’s SUMIF function adds values that match a specific condition.
For example, to calculate all grocery expenses, use:
=SUMIF(B2:B1000,"Groceries",D2:D1000)
Here:
- B2 contains expense categories.
- “Groceries” identifies the category to calculate.
- D2 contains expense amounts.
To calculate transport expenses, use:
=SUMIF(B2:B1000,"Transport",D2:D1000)
You can create a category summary in the Budget Summary worksheet.
Enter the category names in Column A, starting at A2.
In B2, enter:
=SUMIF('Monthly Expenses'!$B$2:$B$1000,A2,'Monthly Expenses'!$D$2:$D$1000)
Copy this formula downward for each category.
Excel will calculate each category’s spending based on the name in Column A.
This is more convenient than writing a different formula for every category.
Official reference: Microsoft SUMIF function
Step 6: Create a Monthly Budget Summary
A budget summary compares your planned spending with your actual spending.
Consider this illustrative monthly budget for someone earning ₹30,000.
| Category | Budget (₹) | Actual (₹) |
|---|---|---|
| Rent | 8,000 | 8,000 |
| Groceries | 4,000 | 4,500 |
| Transport | 2,000 | 1,800 |
| Utilities | 2,000 | 1,700 |
| Food | 2,000 | 2,500 |
| Healthcare | 1,000 | 600 |
| Shopping | 1,500 | 1,200 |
| Entertainment | 1,000 | 800 |
| Other | 1,500 | 1,400 |
| Total | 23,000 | 22,500 |
The remaining ₹7,000 from the ₹30,000 income is the planned amount available for savings, debt repayment, or other financial goals.
Actual spending of ₹22,500 leaves ₹7,500 before any unrecorded expenses or transfers.
To calculate the difference between budget and actual spending, add a fourth column named Variance.
If Budget is in B2 and Actual is in C2, use:
=B2-C2
A positive result means you spent less than budgeted.
A negative result means you exceeded the budget.
For example, groceries with a ₹4,000 budget and ₹4,500 actual spending produce a variance of -₹500.
This makes overspending easy to identify.
Step 7: Add a Spending Chart and Review Your Budget
Charts help you understand your expense distribution visually.
In the Budget Summary worksheet:
- Select your category names and actual spending totals.
- Open the Insert tab.
- Choose a Column Chart or Pie Chart.
- Add a clear chart title such as “Monthly Expenses by Category”.
- Check that all categories and values are displayed correctly.
A column chart is particularly useful when comparing spending across several categories.
A pie chart can show how different categories contribute to the total.
Review the chart at the end of each week and again at the end of the month.
Look for categories where spending is increasing or consistently exceeding the budget.
Monthly Expense Tracker Excel Example for a ₹30,000 Salary
A tracker becomes more useful when it connects expenses with your actual income.
Consider this example:
| Monthly Summary | Amount |
|---|---|
| Monthly Take-Home Salary | ₹30,000 |
| Total Planned Expenses | ₹23,000 |
| Actual Recorded Expenses | ₹22,500 |
| Planned Amount Remaining | ₹7,000 |
| Actual Amount Remaining | ₹7,500 |
The actual amount remaining is calculated as:
=30000-22500
Result: ₹7,500.
You can use cell references instead of fixed numbers.
For example, if monthly income is entered in B2 and total actual expenses in B3:
=B2-B3
This formula automatically updates whenever income or expenses change.
Remember that the remaining balance is not necessarily the same as money saved.
If you have outstanding bills, loan repayments, or other commitments that are not recorded, those must also be considered.
Similarly, moving money between your own bank accounts should not automatically be treated as an expense.
[INTERNAL LINK: How to Save Money on a ₹25,000 Salary]
How to Track Expenses for One Specific Month
If you use the same transaction sheet throughout the year, you need a way to calculate expenses for a selected month.
Excel’s SUMIFS function can add amounts based on multiple conditions.
For example, if transaction dates are in Column A and expense amounts are in Column D, the following formula calculates spending during October 2026:
=SUMIFS(D2:D1000,A2:A1000,">="&DATE(2026,10,1),A2:A1000,"<"&DATE(2026,11,1))
The formula includes transactions dated from 1 October up to, but not including, 1 November.
This approach works when Column A contains valid Excel dates rather than dates stored as text.
It is especially useful when you want to maintain a single workbook for an entire year.
Alternatively, beginners can create a separate worksheet for each month.
Choose the method you find easiest to maintain.
Common Mistakes to Avoid When Tracking Expenses in Excel
Forgetting Small Purchases
Daily snacks, parking charges, and small UPI payments can accumulate.
Record them regularly rather than relying on memory at the end of the month.
Using Too Many Categories
An overly complicated category system makes tracking inconvenient.
Start with approximately 8–12 categories and add more only when necessary.
Mixing Income and Expenses
Do not add salary receipts and expenditure into the same amount column without a clear transaction-type distinction.
For this beginner setup, keep income in the summary sheet and expenses in the transaction sheet.
Counting Credit Card Payments Twice
If you record purchases when they occur, paying the credit card bill later is generally a settlement of those recorded purchases, not another expense.
Double-counting can make spending appear higher than it actually is.
Ignoring Cash Transactions
UPI and card payments may be easier to trace, but cash purchases also affect your budget.
Record them using the payment method “Cash”.
Forgetting Irregular Expenses
Insurance premiums, annual subscriptions, festival purchases, and vehicle maintenance can disrupt a monthly budget.
Consider setting aside a small amount each month for predictable irregular expenses.
Not Reviewing the Tracker
Recording transactions is only the first step.
The real value comes from reviewing the information and making better spending decisions.
Excel Expense Tracker vs Expense Tracking Apps
Both Excel spreadsheets and expense tracking apps can help you monitor spending.
| Feature | Excel Tracker | Expense Tracking App |
|---|---|---|
| Customization | Highly flexible | Depends on app |
| Automatic calculations | Yes, with formulas | Usually included |
| Manual entry | Usually required | Manual or automated |
| Internet requirement | Not always | Depends on app |
| Data storage | Local or cloud | Depends on service |
| Learning curve | Basic Excel knowledge | Depends on interface |
| Cost | Depends on Excel access | Free or paid options |
Excel is useful when you want full control over categories, calculations, and reporting.
An expense tracking app may be more convenient when automatic transaction imports or mobile-first entry are priorities.
Neither option is automatically better for everyone.
Choose the method you can maintain consistently.
How to Make Your Monthly Expense Tracker More Effective
A few simple habits can improve the usefulness of your spreadsheet.
Record expenses regularly. Update your tracker daily or every few days while transactions are still easy to remember.
Use consistent payment descriptions. Clearly identify whether each transaction was paid through UPI, cash, card, or bank transfer.
Review spending weekly. Compare category totals with the budget before the month ends.
Keep a separate savings target. Decide how much you intend to save, then check whether your actual spending supports that goal.
Back up the workbook. Store a secure backup so your records are not lost if your device fails.
Protect sensitive information. Avoid putting account passwords, PINs, full card numbers, or unnecessary banking details into the spreadsheet.
Compare multiple months. Over time, look for recurring expenses, seasonal changes, and opportunities to reduce unnecessary costs.
[INTERNAL LINK: Zero-Based Budget Example for ₹20,000 Salary]
Practical Monthly Expense Tracking Routine
You do not need to spend hours maintaining an Excel tracker.
A straightforward routine can be enough.
Daily: Record new transactions with their date, category, amount, and payment method.
Weekly: Review category totals and check whether spending is within budget.
Monthly: Compare income, total expenses, planned savings, and actual remaining money.
Every three months: Review recurring subscriptions, spending patterns, and budget categories.
This routine turns your spreadsheet from a transaction log into a practical budgeting tool.
Conclusion
A monthly expense tracker excel spreadsheet is a simple way for beginners to understand and manage everyday spending.
By creating transaction columns, organizing expenses into categories, using SUM and SUMIF formulas, and comparing actual spending with a monthly budget, you can build a useful financial tracking system without advanced Excel knowledge.
Start with a basic worksheet rather than a complicated dashboard. Record your expenses consistently, review the totals, and improve the tracker as your needs grow.
The goal is not to create a perfect spreadsheet. It is to develop a clearer understanding of your money and make more informed financial decisions each month.
Frequently Asked Questions
1. How do I create a monthly expense tracker in Excel?
Open a blank Excel workbook and create columns for Date, Category, Description, Amount, and Payment Method. Enter your daily expenses and use the SUM formula to calculate total spending. Add a separate budget summary to compare your planned and actual expenses.
2. What is the best Excel formula for tracking monthly expenses?
The SUM formula is useful for calculating total expenses. For example, =SUM(D2:D1000) adds the amounts in Column D. To calculate spending by category, use SUMIF. To calculate spending for a particular month using transaction dates, use SUMIFS.
3. Can I use Excel to track expenses for free?
You can create a basic expense tracker using Excel for the web with an eligible free Microsoft account. Desktop Excel availability depends on your Microsoft Office or Microsoft 365 licence. Free spreadsheet alternatives are also available.
4. What categories should I include in a monthly expense tracker?
Common categories include rent, groceries, transportation, utilities, food, healthcare, shopping, entertainment, education, and miscellaneous expenses. Choose categories that reflect your actual spending habits and keep the names consistent.
5. How can I track daily expenses in Excel?
Enter each transaction on a new row with its date, category, description, amount, and payment method. Update the sheet regularly and review category totals weekly. Excel formulas can calculate spending automatically from the recorded transactions.
6. Is Excel better than an expense tracking app?
Excel is useful for people who prefer customization, manual control, and flexible reporting. Expense tracking apps may offer easier mobile entry and automatic transaction imports. The better choice depends on your preferences, privacy requirements, and willingness to maintain records.